Conversational
Marketing Analytics
You ask in plain language. You get the answer. A new way to work with marketing data - where the dashboard is no longer standing between the question and the reply.
Conversational marketing analytics is a category of marketing software where you ask questions about your campaign data in plain language and get a verified answer in seconds - instead of building and reading dashboards. The chat is the interface. The finished report is the result. ratio is the platform built for it.
There's a gap between the question you ask and the answer you get.
We call it the Request-Reply Gap. It isn't a tooling problem - it's a design assumption baked into how marketing analytics has always worked: that the people who need answers and the people who build reports are the same person. They're not. The gap is the distance between them, and it shows up in three ways.
Urgency ≠ speed
The simplest, most urgent questions take the longest to answer. By the time the report arrives, the decision window is gone.
Intent ≠ output
You ask one thing. The data replies with something else. "Leads" comes back three different ways. Same word, different numbers.
Question ≠ answer's location
Questions live in heads and chats. Answers live in dashboards most marketers can't navigate. The two never meet.

Query your data the way you'd ask a colleague.
Conversational marketing analytics is an approach where marketers query and analyze campaign data in everyday language - instead of building and reading dashboards. You type the question you actually have. You get the answer, plus the right visualization to back it up.
No query builder. No BI training. No ticket to the data team. The interface is the conversation. The output is a verified answer you can act on, or save as a view your team returns to.
Why this category exists now, and not five years ago.
Plain-language querying isn't new as an idea. What's new is that it finally works on governed numbers. Language models became reliable enough to map a messy human question onto a precise, defined metric - and return an answer you can trust in a budget meeting. The interface caught up to the question. That's the unlock that turns a nice idea into a category.
Three different jobs. Only one of them is answering.
This isn't a faster dashboard. It's a different job entirely. The tools that came before were built to explore data or to collect it - both leave the actual answering to a human. Conversational marketing analytics is built to answer.
Built so an analyst can dig through data. You have to know what you're looking for and assemble the view yourself. Powerful - and a full-time skill.
Built to pull every source into one place. Solves the gathering. Leaves the analysis, the interpretation, and the answer with you.
Built so anyone can ask and get a verified answer. No view to build, no data to assemble. Question in, insight out - in one shared language.
"How did our campaign go last week?"
Every tool can technically get you there. The difference is how much stands between the question and the answer - and who has to operate it.
| ratio | Looker Studio | Power BI | Conversational BI (LLM on a warehouse) | LLM + file upload (ChatGPT, Claude) | Spreadsheets | |
|---|---|---|---|---|---|---|
| Time to answer | Seconds - just ask | Build the chart first | Build the report first | Fast - once it's wired up | Fast, but one-off | Pull, paste, formula |
| Setup | ~5 min, connect & ask | Hours-days, connectors break | Steep learning curve | Needs a data warehouse first | None - but you export every time | Manual, every single time |
| One agreed number | Your governed definitions | Everyone rebuilds ROAS | Depends who built it | Only as governed as the warehouse | No memory between chats | Depends on the tab |
| Can it invent a number? | Verified, traceable | No - but no answer either | No - but no answer either | Risk if the layer is thin | Yes - guesses on loose files | Only your formula errors |
| Who operates it | Anyone on the team | An analyst | An analyst | A data team | Whoever has the file | Whoever owns the sheet |
BI tools and spreadsheets make you build the answer. An LLM with an uploaded file will guess at one- confidently, on data it can't verify. Conversational BI gets close, but it lives on top of a warehouse a data team still has to own. Conversational marketing analytics is the only one built so anyone can ask and trust what comes back.
Most of the report isn't the report.
One weekly performance report, counted honestly. The part that's actually the job is the smallest slice of it.
The first three hours are the gap, made visible. Conversational marketing analytics collapses them. Time-to-answer drops from hours to seconds - and the part that's actually the work moves to the center.
"A chatbot on my numbers? It'll invent something and I'll present a wrong figure."
Fair. That's exactly the failure a category built for answers has to rule out - and it's the line between conversational analytics and a chatbot pointed at a spreadsheet.
Your definitions, not its own
CPL, what counts as a lead, which campaigns map to which brand - set once. The answer uses your governed metrics, every time.
Verified, not generated
Answers resolve against your actual connected data with plausibility checks - not a model guessing at a plausible-sounding number.
Traceable
Every answer can be opened, saved as a view, and checked. You see what it counted and how. Nothing is a black box.
For marketers who need answers - not dashboard mechanics.
If your job is to act on numbers but you have no time or appetite for building views and reading charts, this is for you. The whole point is to remove the distance between the question you have and the answer you need.
Senior & performance marketers
Budget responsibility, fluent in the stack, tired of living in spreadsheets. Ask in plain language, get the approved number, move.
Everyday marketers
Every data question used to route through someone else. Now: answers without opening a ticket, in one conversation.
Analytics & performance leads
Define the metrics once. The basic questions route away from you. Your definitions travel into everyone's work.
Agencies & consultants
Answers across multiple client accounts, each isolated, without rebuilding a dashboard for every question.
Conversational marketing analytics, in plain answers.
What is conversational marketing analytics?
An approach where marketers query and analyze campaign data in plain language instead of building and reading dashboards. You ask in everyday words and receive a verified answer plus the right visualization, using your team's own metric definitions. The chat is the interface; the finished report is the result.
How is it different from BI and dashboard tools?
BI and dashboard tools are built for exploring data - an analyst has to know what to look for and assemble the view. Reporting tools are built for collecting data but leave the analysis to a human. Conversational marketing analytics is built for answering: you ask, you get a verified answer directly, with no view to build and no data team as a bottleneck.
Does it hallucinate or invent numbers?
A well-built tool resolves answers against your actual connected data using your governed definitions and plausibility checks, rather than generating a plausible-sounding number. Answers are traceable - you can open a saved view and see what was counted and how. That's the difference from a chatbot pointed at a spreadsheet.
Who is it for?
Marketers who need to act on numbers but have no time for building dashboards: senior and performance marketers, everyday marketers who route every question through someone else, analytics leads who want to define metrics once, and agencies managing multiple client accounts.
Why has this category emerged now?
Plain-language querying isn't new, but it only recently became reliable on governed numbers. Language models became accurate enough to map a messy human question onto a precise, defined metric and return an answer trustworthy enough for a budget meeting. The interface finally caught up to the question.
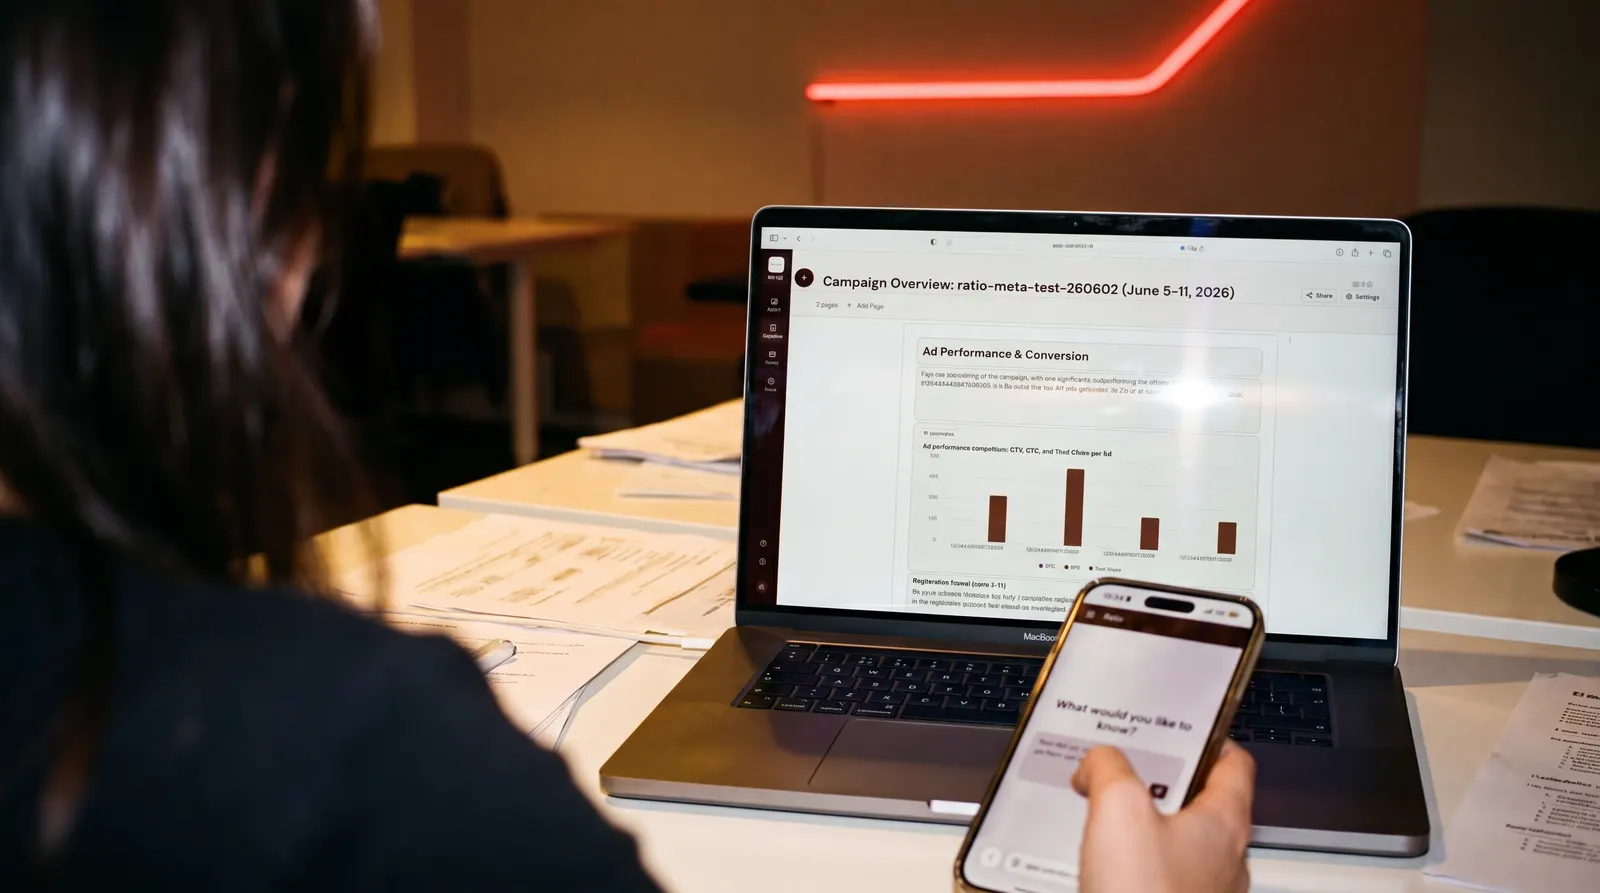
The question on the phone. The answer on the screen. No dashboard in between.
The question you ask is the answer you get.
That's the category. ratio is how you work in it - marketing data into instant, trusted answers to plain-language questions. No dashboards. No spreadsheets. No waiting.
30 days full access. All connectors. No credit card to start.